Appendix C: Statistics of the Ryukyus Campaign
The following tables and charts are included to illustrate certain quantitative aspects of the Ryukyus campaign. Unfortunately, data are not available to permit a complete statistical summary of all phases of the campaign. Nevertheless, the data presented serve to indicate statistically the intensity of the fighting on Okinawa and the magnitude of the logistical effort necessary to support this operation.
The material shown in this appendix has been drawn from the most reliable sources. In instances where figures were available from more than one source, and were in conflict, all data were carefully weighed to ensure that the most reliable were used. Figures included in the text, however, were not always given in such sources, since refined summary data usually do not reflect the status of operations as of a given date or at the conclusion of a specific engagement. In such instances the only recourse was to periodic reports, prepared under the stress of battle and subject to revision as more details were learned. For this reason, sources cited in the text, while representing the best available for the data shown, will not always agree with those cited in appendix tables.
Table 1: Strength of Army, Marine, and Naval Forces of Tenth Army in the Ryukyus Campaign, 30 April-30 June 1945
| Command and Unit* | 30 April | 31 May | 30 June | ||||||
| Total | Officers† | Enlisted | Total | Officers† | Enlisted | Total | Officers† | Enlisted | |
| ARMY | 102,250 | 6,379 | 95,871 | 167,971 | 10,991 | 156,980 | 190,301 | 13,810 | 176,491 |
| 7th Division | 15,483 | 794 | 14,689 | 17,263 | 800 | 16,463 | 15,584 | 798 | 14,786 |
| 27th Division | 13,488 | 722 | 12,766 | 12,404 | 679 | 11,725 | 11,624 | 652 | 10,972 |
| 77th Division | 12,000 | 656 | 11,344 | 15,185 | 766 | 14,419 | 12,853 | 824 | 12,029 |
| 96th Division | 13,146 | 798 | 12,348 | 14,220 | 706 | 13,514 | 13,140 | 751 | 12,389 |
| Non-divisional Ground Force Units‡ | 38,200 | 2,591 | 35,609 | 55,607 | 3,512 | 52,095 | 60,501 | 3,847 | 56,654 |
| Service Forces | 8,918 | 643 | 8,275 | 30,053 | 2,107 | 27,946 | 36,764 | 2,688 | 34,076 |
| Other§ | 1,015 | 175 | 840 | 23,239 | 2,421 | 20,818 | 39,835 | 4,250 | 35,585 |
| MARINE** | 88,500 | n.a. | n.a. | 58,894 | n.a. | n.a. | 2,489 | n.a. | n.a. |
| NAVY** | 18,000 | n.a. | n.a. | 21,793 | n.a. | n.a. | 1,225 | n.a. | n.a. |
* Figures represent assigned strength rather than actual effective strength. In accordance with WD Circular No. 280, 6 July 1944, hospital patients in the Ryukyus were carried on the rolls of their respective organizations during hospitalization or until completion of the prescribed period of 60 days of total hospitalization.
† Includes warrant officers, flight officers, nurses, dieticians, and physical therapists.
‡ Includes armored forces, artillery, service units, and headquarters troops that were not specifically assigned to infantry divisions.
§ Includes air-force-type units, overhead, replacements, and other miscellaneous units and personnel assigned to the Ryukyus operation and all theater-attached strength.
** Figures shown represent total strength of Marine and Navy units attached to the Tenth Army for the Ryukyus campaign. The marked decline shown for June is the result of reassignment of the units involved rather than of large-scale evacuation of personnel.
Source: U.S. War Department Monthly Strength Reports.
Table 2: Comparative American and Enemy Major Losses in the Ryukyus Campaign, 1 April-30 June 1945
| Nature of Loss | American | Enemy |
| PERSONNEL | ||
| – Killed, Total | 12,281 | 110,071 a |
| –– Army | 4,582 b | n.a. |
| –– Marine | 2,792 b | n.a. |
| ––Navy | 4,907 | n.a. |
| –Captured | n.a. | 7,401 c |
| AIRCRAFT | ||
| –Planes Lost, Total | 763 d | 7,830 e |
| –– Combat | 458 | 4,155 |
| –– Operational | 305 | 2,655 |
| –– Destroyed on Ground | (f) | 1,020 |
| SHIPS | ||
| –Sunk | 36 g | 16 |
| –Damaged | 368 h | 4 |
a. Data are from USAFWESPAC G-2 Periodic Report No. 15, 26 November–2 December 1945. The figure shown includes an unknown number of Okinawan conscripts and civilians. This, together with possible errors in counting the dead, accounts for the apparent discrepancy between total Japanese casualties and the total Japanese strength of 77,199 at the beginning of the campaign, as shown in Appendix B.
b. Data are from U.S. Tenth Army Action Report Ryukyus, 26 March to 30 June 1945, Vol. 1, Ch. 11, Sec. I, p. 12. Figure for Marine personnel killed includes data for Tactical Air Force.
c. Does not include 3,339 unarmed laborers and 15 combat civilians captured. Additional prisoners of war captured after the campaign raised the total to 16,346 by the end of November 1945.
d. Includes 98 from British carriers (26 combat and 72 operational).
e. Comprises 3,605 army planes and 4,225 navy planes, of which 850 and 1,050, respectively, were suicide planes.
f. Data are not available to indicate the total number of American planes destroyed on the ground. However, authenticated reports of at least 7 such losses are available (see p. 361).
g. Includes 26 sunk by suicide planes.
h. Includes 164 damaged by suicide planes.
Source: United States Strategic Bombing Survey, The Campaigns of the Pacific War, Ch. XIV, Appendix 99, p. 331 except as otherwise indicated.
Table 3: Casualties Sustained by Tenth Army, 1 April-30 June 1945
| Unit a | Total | Battle Casualties | Non-battle Casualties | |||
| Total | Killed b | Wounded c | Missing | |||
| ALL UNITS | 65,631 | 39,420 | 7,374 | 31,807 | 239 | 26,211 |
| XXIV Corps | 34,736 | 22,182 | 4,412 | 17,689 | 81 | 12,554 |
| 7th Division | 10,893 | 6,068 | 1,122 | 4,943 | 3 | 4,825 |
| 27th Division | 5,224 | 3,255 | 711 | 2,520 | 24 | 1,969 |
| 77th Division | 7,126 | 5,026 | 1,018 | 3,968 | 40 | 2,100 |
| 96th Division | 10,247 | 7,430 | 1,506 | 5,912 | 12 | 2,817 |
| Corps Troops | 1,246 | 403 | 55 | 346 | 2 | 843 |
| III Amphibious Corps | 26,724 | 16,507 | 2,779 | 13,609 | 119 | 10,217 |
| 1st Division | 13,002 | 7,901 | 1,115 | 6,745 | 41 | 5,101 |
| 2nd Division d | 95 | 94 | 7 | 26 | 61 | 1 |
| 6th Division | 12,815 | 8,326 | 1,622 | 6,689 | 15 | 4,489 |
| Corps Troops | 812 | 186 | 35 | 149 | 2 | 626 |
| Tactical Air Force | 520 | 139 | 13 | 99 | 27 | 381 |
| Army Garrison Forces e | 2,636 | 383 | 110 | 261 | 12 | 2,253 |
| Tenth Army troops f | 1,015 | 209 | 60 | 149 | 806 | |
a. Data are preliminary. Official casualty data will be released at a later date by the U.S. War Department and the U.S. Marine Corps. Figures shown include data for attached units.
b. Includes number that died from wounds.
c. Includes number injured in action.
d. Except for diversionary activities in the south on 1-2 April, the 2nd Marine Division was not actively engaged in the campaign. However, on 16 June, the 8th Regimental Combat Team of the division was landed to provide reinforcement.
e. Comprises AGE 331 (Island Command, Okinawa) and AGF 245 (Ie Shima).
f. Includes data for Medical Service, distributed as follows: 1 killed, 17 wounded, and 254 nonbattle casualties.
Source: U.S. Tenth Army Action Report Ryukyus, 26 March to 30 June 1945, Vol. 1, Ch. 11, Sec. 1, p. 12.
Chart 1: Tenth Army Weekly Battle Casualties, 1 April-30 June 1945
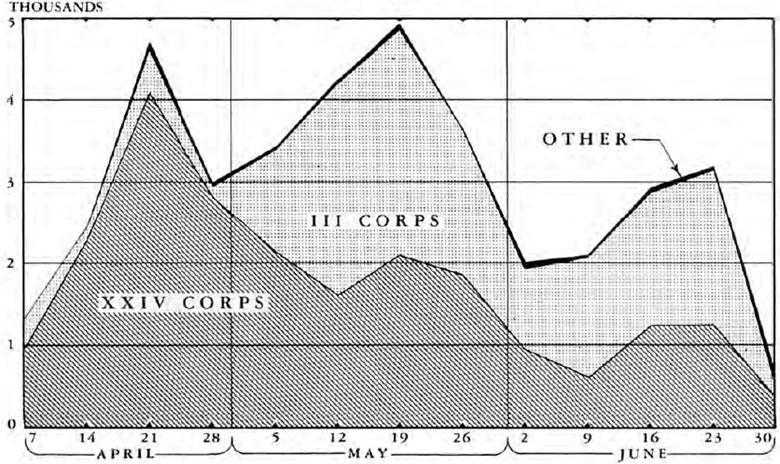
By Corps
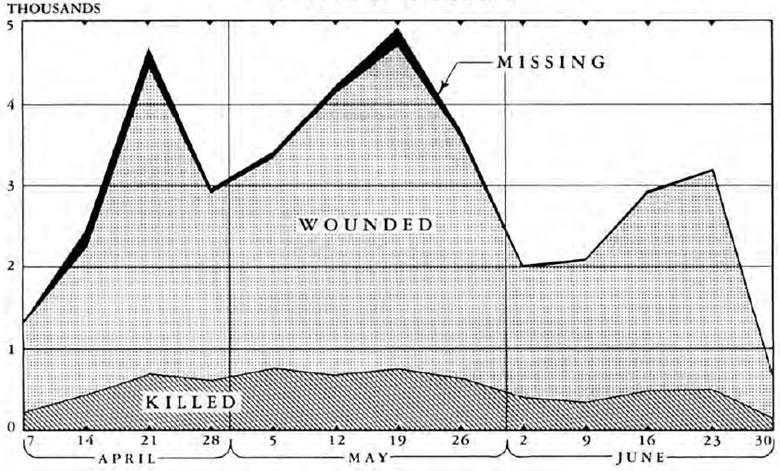
By Type of Casualty
Source: U.S. Tenth Army, G-1 Periodic Reports.
Table 4: Troops and Supplier Loaded for the Initial Assault on the Ryukyus
| Unit a | Number of Assault Troops | Supplies | |||||||
| Total | Officers | Enlisted Men | Measurement Tons b | Short Tons | |||||
| Total | Vehicles | Cargo | Total | Vehicles | Cargo | ||||
| ALL UNITS | 182,821 | 10,746 | 172,075 | 746,850 | 503,555 | 243,295 | 286,635 | 129,917 | 156,718 |
| XXIV Corps | 88,415 | 5,087 | 83,328 | 385,691 | 282,093 | 103,598 | 142,634 | 72,695 | 69,935 |
| 7th Division | 21,929 | 1,150 | 20,779 | 95,789 | 70,382 | 25,407 | 34,856 | 18,272 | 16,584 |
| 27th Division | 16,143 | 970 | 15,173 | 62,151 | 38,737 | 23,414 | 23,739 | 10,445 | 13,294 |
| 77th Division | 20,981 | 1,170 | 19,811 | 99,999 | 76,698 | 23,301 | 34,936 | 18,271 | 16,665 |
| 96th Division | 22,330 | 1,256 | 21,074 | 85,066 | 63,708 | 21,358 | 34,302 | 17,381 | 16,927 |
| Corps Troops | 7,032 | 541 | 6,491 | 42,686 | 32,568 | 10,118 | 14,801 | 8,326 | 6,475 |
| III Amphibious Corps | 85,247 | 4,595 | 80,652 | 294,430 | 189,934 | 104,496 | 112,240 | 49,449 | 62,797 |
| 1st Division | 26,274 | 1,401 | 24,873 | 80,765 | 48,585 | 32,180 | 31,463 | 14,226 | 17,237 |
|
2nd Division d |
22,195 | 1,183 | 21,012 | 57,883 | 36,833 | 21,050 | 22,971 | 9,554 | 13,417 |
| 6th Division | 24,356 | 1,294 | 23,062 | 78,748 | 52,267 | 26,481 | 28,031 | 12,564 | 15,467 |
| Corps Troops | 12,422 | 717 | 11,705 | 77,034 | 52,249 | 24,785 | 29,775 | 13,105 | 16,670 |
| Tactical Air Force | 3,172 | 390 | 2,782 | 23,879 | 11,578 | 12,301 | 9,849 | 2,296 | 7,553 |
| Tenth Army Troops | 5,417 | 628 | 4,789 | 21,806 | 13,091 | 8,715 | 9,533 | 4,157 | 5,376 |
| Miscellaneous Units c | 570 | 46 | 524 | 21,044 | 6,859 | 14,185 | 12,379 | 1,320 | 11,059 |
a. Does not include data for first echelon garrison force comprising 11,031 men and 77,717 measurement tons (26,160 short tons) of supplies. Figures shown include data for attached units, grouped according to the corps or division to which assigned.
b. Unit of volume used for measuring cargo, based on 40 cubic feet of shipping space per ton.
c. Includes units and supplies for Military Government, Naval Air Base, Air Defense Command, and naval resupply.
Source: Commander Task Force 51, Commander Amphibious Forces U.S. Pacific Fleet. Report on Okinawa Gunto Operation from 17 February to 17 May 1945. Pt. V, Sec. 1.
Table 5: Personnel and Supplier Loaded for Assault and for First Echelon Garrison in the Ryukyus Campaign, by Point of Embarkation
| Point of Embarkation a | Number of Ships | Number of Troops | Supplies | |
| Measurement Tons | Short Tons | |||
| TOTAL | 458 | 193,852 | 824,567 | 312,795 |
| Leyte | 186 | 71,163 | 320,148 | 117,884 |
| Guadalcanal–Espiritu–Russells | 159 | 74,970 | 285,279 | 108,435 |
| Saipan–Tinian–Guam | 61 | 31,771 | 119,673 | 47,446 |
| Oahu | 39 | 12,837 | 69,423 | 26,762 |
| San Francisco–Seattle b | 13 | 3,111 | 30,044 | 12,268 |
a. Includes data for first echelon garrison force comprising 21 ships carrying 11,031 men and 77,717 measurement tons (26,160 short tons) of supplies.
b. Includes minor quantities loaded at Roi.
Source: Office of the Chief of Naval Operations, Amphibious Operations – Capture of Okinawa (Ryukyus Operations), 27 March to 21 June 1945, Ch. VII, “Logistics,” p. 7-24.
Table 6: Comparison of Estimated Capacities for Unloading at Okinawa Beaches and Quantities Actually Unloaded, 1 April-30 June 1945
| Period a | Estimated Capacities b (M/Ts) | Actual Discharge (M/Ts) | Percent Deviation from Estimates | |
| Each Period | Cumulative | |||
| TOTAL | 1,981,495 | 2,016,490 | +1.8 | +1.8 |
| 1-16 April | 529,995 | 577,040 | +8.9 | +8.5 |
| 17-26 April | 98,500 | 202,085 | +105.2 | +24.0 |
| 27 April-6 May | 169,000 | 200,877 | +18.9 | +22.9 |
| 7-16 May | 205,500 | 166,870 | -18.8 | +14.3 |
| 17-26 May | 239,000 | 170,886 | -28.5 | +6.1 |
| 27 May-5 June | 261,000 | 159,274 | -39.0 | -1.7 |
| 6-15 June | 189,000 | 163,863 | -13.3 | -3.0 |
| 16-25 June | 193,000 | 188,046 | -2.6 | -3.0 |
| 26-30 June | 96,500 c | 187,549 | +94.4 | +1.8 |
a. Does not include 206,598 measurement tons unloaded at Ie Shima from 16 April through 30 June.
b. Estimates of capacities varied with the expected progress of the campaign and the consequent expansion of unloading facilities at some beaches and partial or complete abandonment of others.
c. No estimate available beyond 25 June. Figure shown is interpolated, based on estimate for 16-25 June.
Source: U.S. Tenth Army Action Report Ryukyus, 26 March to 30 June 1945, Vol. 1, Ch. 11, Sec. IV, pp. 43 ff.
Chart 2: Comparison of Estimated Capacities for Unloading at Okinawa Beaches and Quantities Actually Unloaded, 1 April-30 June 1945
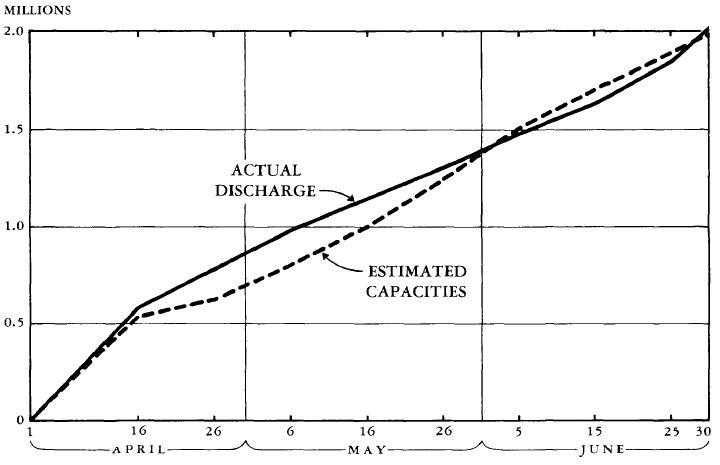
Source: U.S. Tenth Army Action Report Ryukyus, 26 March to 30 June 1945, Vol. 1, pp. 43 ff.
Table 7: Cargo Unloaded at Okinawa Beaches, 1 April-30 June 1945
(Measurement Tons)
| Period a | Cargo Available for Discharge b | Discharged | |||||
| All Types | Assault | Garrison | Maintenance | Ground Ammunition | |||
| Quantity | Percent Distribution | ||||||
| TOTAL | 2,883,917 | 2,016,490 | 100.0 | 673,067 | 839,190 | 352,353 | 151,880 |
| 1–16 April | 917,056 | 577,040 | 28.6 | 537,568 | 18,104 | 5,264 | 16,104 |
| 17–26 April | 203,861 | 202,085 | 10.0 | 104,144 | 50,875 | 26,350 | 20,716 |
| 27 April–6 May | 211,918 | 200,877 | 10.0 | 31,355 | 117,800 | 31,732 | 19,990 |
| 7–16 May | 211,728 | 166,870 | 8.3 | – | 102,646 | 33,957 | 30,267 |
| 17–26 May | 274,894 | 170,886 | 8.5 | – | 96,680 | 48,625 | 25,581 |
| 27 May–5 June | 252,873 | 159,274 | 7.9 | – | 114,119 | 34,473 | 10,682 |
| 6–15 June | 267,550 | 163,863 | 8.1 | – | 99,624 | 55,846 | 8,393 |
| 16–25 June | 248,132 | 188,046 | 9.3 | – | 98,011 | 74,002 | 16,033 |
| 26–30 June | 295,905 | 187,549 | 9.3 | – | 141,331 | 42,104 | 4,114 |
a. Does not include 206,598 measurement tons unloaded at Ie Shima from 16 April through 30 June.
b. Includes cargo available for discharge in the target area and cargo loaded on ships at the regulating station.
Source: U.S. Tenth Army Action Report Ryukyus, 26 March to 30 June 1945, Vol. 1. Ch. 11, Sec. IV, pp. 51 ff.
Chart 3: Average Daily Volume of Supplier Unloaded in the Ryukyus, 1 April-16 May 1945
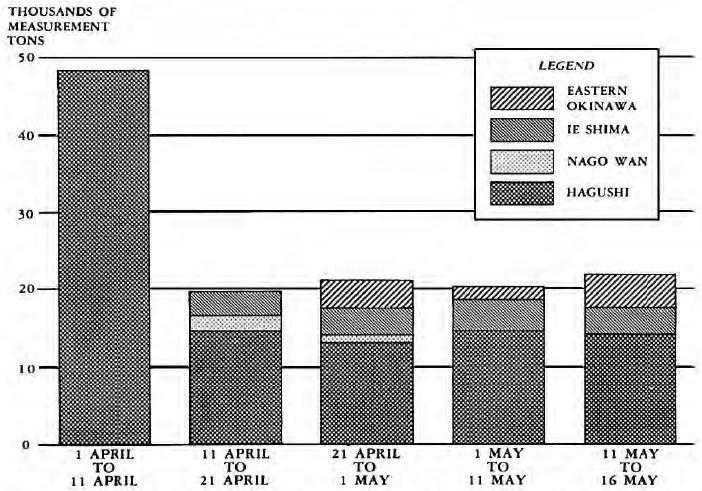
Source: Office of the Chief of Naval Operations, Amphibious Operations, Capture of Okinawa (Ryukyus Operations), 27 March to 21 June 1945, p. 7-46.
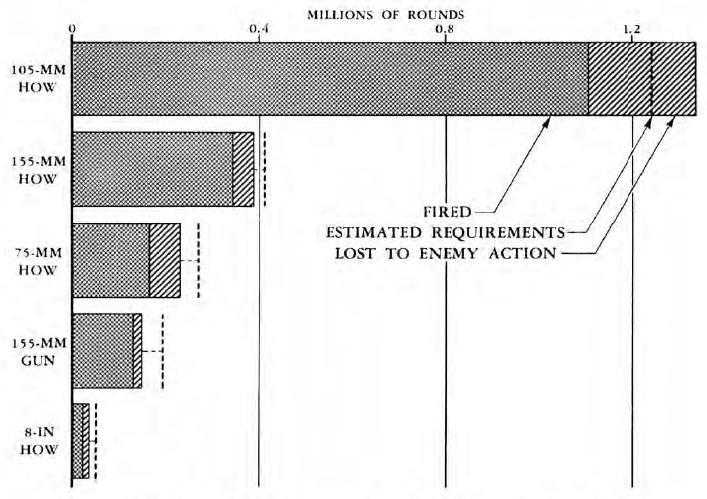
Table 8: Ammunition Expended by Tenth Army Field Artillery, 1 April-30 June 1945
(Number of Rounds)
| Type of Weapon | Estimated Requirements | Supply Available a | Quantity Expended | ||
| Total | Fired | Lost to Enemy Action | |||
| TOTAL | 2,119,760 | 3,315,209 | 2,116,691 | 1,766,352 | 350,339 |
| Howitzer, 75-mm | 266,640 | 612,020 | 230,067 | 166,068 | 63,999 |
| Howitzer, 105-mm | 1,236,700 | 1,889,452 | 1,330,137 | 1,104,630 | 225,507 |
| Howitzer, 155-mm | 400,980 | 566,574 | 390,996 | 346,914 | 44,082 |
| Gun, 155-mm | 190,400 | 212,235 | 142,783 | 129,624 | 13,159 |
| Howitzer, 8-inch | 25,040 | 34,928 | 22,708 | 19,116 | |
a. Represents total quantities on hand during the period 1 April-22 June; does not include quantities in transit on 22 June.
Source: U.S. Tenth Army Action Report Ryukyus. 26 March to 30 June 1945, Vol. 1, Ch. 11, Sec. VI, p. 78.
Chart 4: Ammunition Expended by Tenth Army Field Artillery, 1 April-30 June 1945
Source: U.S. Tenth Army Action Report, Ryukyus, 26 March to 30 June 1945, Vol. 1, p. 78.
Table 9: Ammunition Expended by the U.S. Navy in the Ryukyus Campaign, March–June 1945
(Number of Rounds Fired)
| Type | Total | Period | ||
| Prior to 1 April | 1 April | 2 April–24 June | ||
| ALL TYPES | 600,018 | 41,543 | 44,825 | 513,650 |
| Star, 5-inch | 66,653 | 500 | 1,500 | 64,653 |
| HC, 5-inch* | 432,008† | 27,750 | 36,250 | 368,008 |
| HC, 6-inch | 46,020 | 4,200 | 3,000 | 38,820 |
| HC, 8-inch | 32,150 | 3,700 | 2,100 | 26,350 |
| HC, 12-inch | 2,700 | 575 | 175 | 1,950 |
| HC, 14-inch | 16,046 | 3,275 | 1,325 | 11,446 |
| HC, 16-inch | 4,411 | 1,543‡ | 475 | 2,393 |
* Includes AAC shells. Proximity-type fuses were not used in shore bombardment. The HC (High Capacity) fragmentation shells detonated on impact.
† Includes approximately 20,000 rounds of antiaircraft fire.
‡ Includes 518 rounds fired by fast battleships.
Source: Tenth Army Action Report Ryukyus, 26 March to 30 June 1945, Vol. I, Ch. 11, Sec. V, p. 19.
Table 10: Ammunition Expended by XXIV Corps, by Type of Weapon, 4 April-21 June 1945
| Weapon* | Total | April | May | June | ||||
| Number of Rounds | Short Tons | Number of Rounds | Short Tons | Number of Rounds | Short Tons | Number of Rounds | Short Tons | |
| ALL TYPES | 64,324 | 24,438 | 28,977 | 10,905 | ||||
| Howitzer, 8-in | 19,008 | 2,224 | 6,077 | 684 | 9,154 | 1,031 | 3,777 | 509 |
| Gun, 155-mm | 79,888 | 5,891 | 32,156 | 2,362 | 34,387 | 2,529 | 13,345 | 1,000 |
| Howitzer, 155-mm | 278,946 | 16,702 | 114,770 | 7,292 | 113,636 | 6,907 | 50,540 | 2,503 |
| Howitzer, 105-mm | 792,371 | 28,152 | 284,695 | 10,427 | 377,436 | 12,799 | 130,240 | 4,926 |
| Howitzer, 75-mm | 179,977 | 2,429 | 68,081 | 919 | 91,126 | 1,230 | 20,770 | 280 |
| Gun, 75-mm | 104,893 | 1,521 | 33,013 | 479 | 43,808 | 635 | 28,072 | 407 |
| Gun, 57-mm | 21,997 | 231 | 7,118 | 74 | 5,682 | 58 | 9,197 | 95 |
| Gun, 37-mm | 87,193 | 204 | 39,362 | 93 | 25,066 | 58 | 22,765 | 53 |
| Mortar, 81-mm | 443,589 | 3,672 | 146,385 | 1,181 | 241,853 | 2,054 | 55,351 | 437 |
| Mortar, 60-mm | 521,301 | 1,626 | 98,117 | 307 | 311,722 | 974 | 111,462 | 345 |
| Rocket Launcher, 2.36-in | 20,359 | 62 | 10,263 | 31 | 7,956 | 24 | 2,140 | 7 |
| Grenade, Hand | 366,734 | 365 | 111,815 | 96 | 181,841 | 192 | 73,078 | 77 |
| Grenade, Rifle | 25,670 | 40 | 15,220 | 25 | 8,254 | 12 | 2,196 | 3 |
| Submachine Gun, cal. .45† | 1,461,180 | 35 | 612,958 | 16 | 683,732 | 15 | 164,490 | 9 |
| Carbine, cal. .30 | 2,009,597 | 34 | 926,778 | 16 | 773,824 | 13 | 308,995 | 5 |
| Rifle, cal. .30 | 9,267,923 | 372 | 3,569,182 | 143 | 4,545,337 | 183 | 1,153,404 | 46 |
| Machine Gun, cal. .30 | 16,285,499 | 627 | 6,091,400 | 234 | 5,745,989 | 221 | 4,448,110 | 172 |
| Machine Gun, cal. .50 | 786,754 | 137 | 394,108 | 59 | 203,456 | 42 | 189,190 | 36 |
* Data for 1-3 April are not available; expenditures after 21 June were negligible.
† Includes relatively minor expenditures of cal. .45 ball ammunition for pistols and revolvers.
Source: Personal records of Col. G. F. Powell, Ordnance Officer, XXIV Corps, U.S. Tenth Army.
Blank page