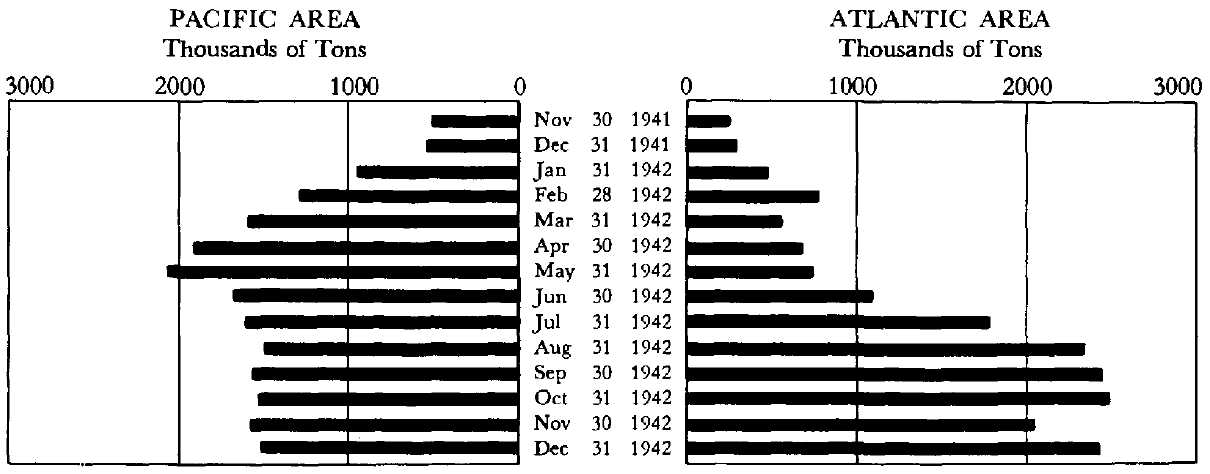
Appendix G: Dead-Weight Tonnage of Vessels Under Army Control in Pacific and Atlantic Areas from November 1941 through December 1942
During the year 1942, shipping in the service of the Army grew from a total of 871,368 dead-weight tons to a total of 3,940,791 dead-weight tons—an increase of 352 percent.
| * | Pacific Area | Atlantic Area (Including Caribbean) | |||||
| Troopships DWT | Cargo Ships DWT | Total DWT | Troopships DWT | Cargo Ships DWT | Total DWT | Grand Total DWT | |
| Nov 30 1941 | 222,963 | 306,201 | 529,164 | 78,561 | 170,789 | 249,350 | 778,514 |
| Dec 31 | 247,233 | 328,885 | 576,118 | 120,403 | 174,847 | 295,250 | 871,368 |
| Jan 31 1942 | 493,320 | 460,226 | 953,546 | 216,639 | 259,337 | 475,976 | 1,429,522 |
| Feb 28 | 345,546 | 949,373 | 1,294,919 | 380,697 | 384,894 | 765,591 | 2,060,510 |
| Mar 31 | 502,417 | 1,087,223 | 1,589,640 | 228,214 | 327,951 | 556,165; | 2,145,805 |
| Apr 30 | 1,610,283 | 1,281,190 | 1,891,473 | 164,640 | 513,136 | 677,776 | 2,569,249 |
| May 31 | 596,145 | 1,435,316 | 2.031,461 | 135,109 | 583,089 | 718,198 | 2,749,659 |
| Jun 30 | 433,203 | 1,230,926 | 1,664,129 | 216,032 | 880,169 | 1,096,201 | 2,760,330 |
| Jul 31 | 319,507 | 1,268,492 | 1,587,999 | 320,543 | 1,495,196 | 1,815. 739 | 3,403,738 |
| Aug 31 | 329,320 | 1,140,141 | 1,469,461 | 323,096 | 2.002,458 | 2,325. 554 | 3,795,015 |
| Sep 30 | 360,993 | 1,204,743 | 1,565,736 | 327,554 | 2,098,325 | 2,425,879 | 3,991,615 |
| Oct 31 | 362,973 | 1,157,105 | 1,520,078 | 343,830 | 2,132,293 | 2,476,123 | 3,996,201 |
| Nov 30 | 351,658 | 1,223,842 | 1,575,500 | 287,298 | 1,758,839 | 2,046,137 | 3,621,637 |
| Dec 31 | 381,123 | 1,139,554 | 1,520,677 | 452,163 | 1,967,951 | 2,420,114 | 3,940,791 |
* Source: Transportation Monthly Progress Report, January 1943, Statistics and Progress Branch, Control Division, Transportation Corps, Services of Supply, War Department, p. 16.